

It’s a dream of nearly every kid and awkward grown-up lugging a baseball glove to a professional ballpark: snagging a foul ball and grabbing a little bit of Major League glory for themselves. And while the “Moneyball” spirit has taken over baseball, making every inch and move on the diamond now subject to measurement, how can those in the stands take advantage of Big Data?
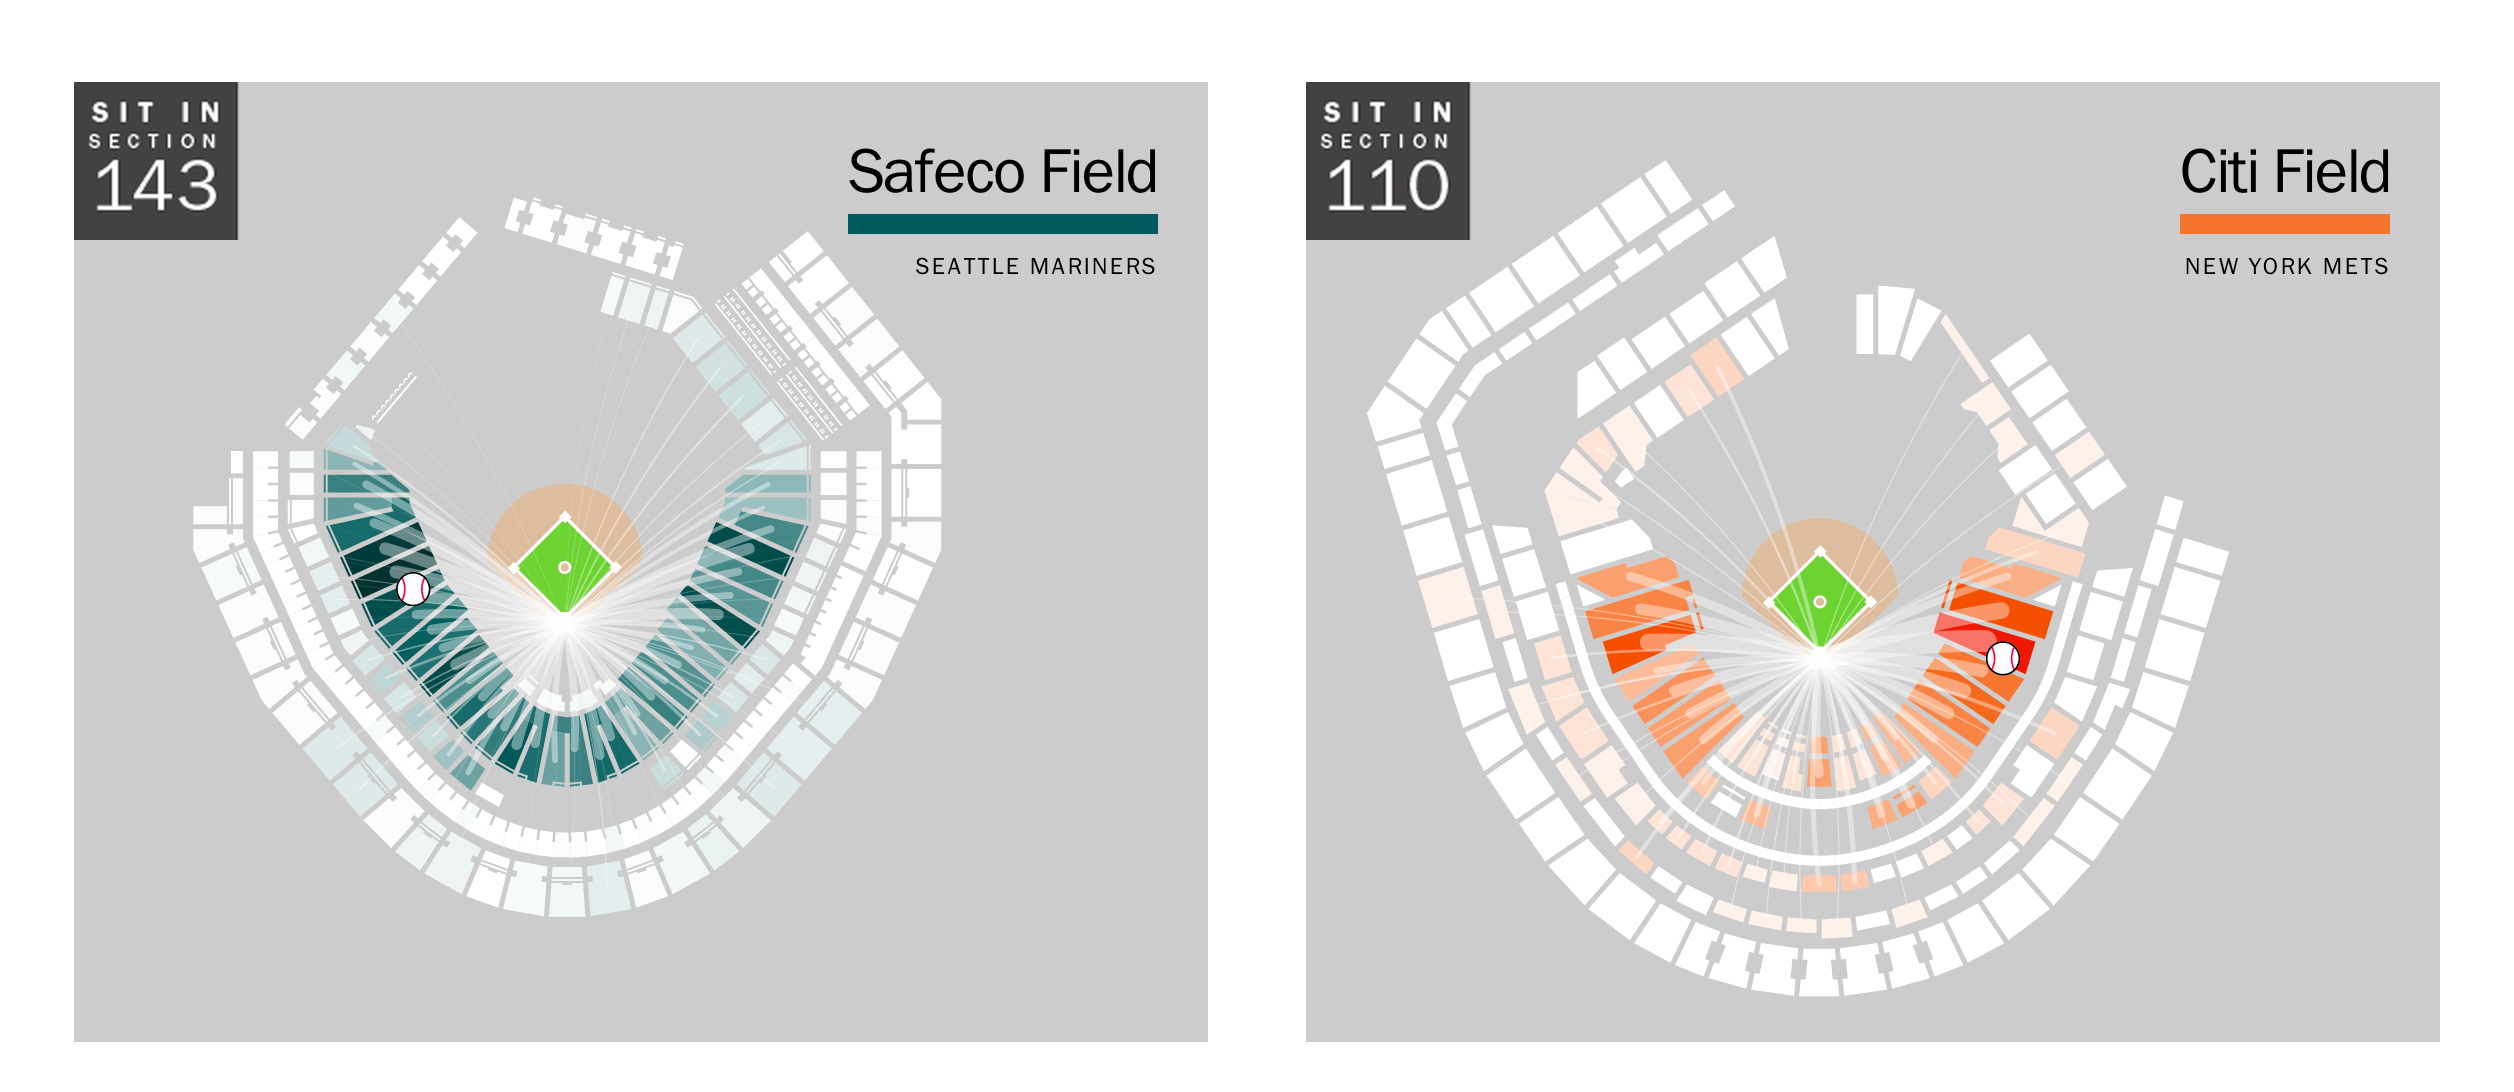
That’s where IdealSeat, an app that tracks what happens off the field, has stepped in, providing a definitive answer to an age-old question: where’s the best place to sit to catch a foul ball or a home run?
Above you’ll find the fruit of this labor, tracking every ball that has been hit off the field in Seattle’s Safeco Field, New York’s Citi Field, San Francisco’s AT&T Park and Tampa Bay’s Tropicana Field, for hundreds of games tracked in the app since 2012. The quirks of the teams that play in those cities as well as the distinct architecture of each stadium means that the hot spots at different ballparks can be far from one another.
But even fans who sit in the hottest territory for foul balls are likely to come up empty handed. According to IdealSeat, an average of 30 hits leave the stadium as home runs or foul balls each game at these four stadiums. And even the sections that are most frequently pelted with errant balls, only see one or two balls a game. The stadium maps above display the probability of catching one of these 30 balls per game. Darker colors represent sections where balls land more often. Hover over or tap each section for details.
So consider yourself warned, foul ball hounds: In San Francisco, head to section 101. At the Mets game, sit in section 110. In Seattle, visit section 143. And when in Tampa Bay, grab a seat in section 104.
Methodology
Data provided by IdealSeatmlb.com, stadium data provided by SeatGeek. The probability for each section is calculated by aggregating all ball data collected for each park by section, then dividing this number by the total number of balls recorded for the relevant stadium. This produces a probability for each section, which is then multiplied by the average 30 balls per game to generate the number of balls that land in that section per game.